
Property Details
| Property Name | Courtyard Apartments |
| Location | Hackensack, NJ |
| Property Description | Apartment – 80 Units, Mid-Rise |
| Water Source/Provider | Municipal |
| Meter Size | 3″ |
| Source | Management Company |
Consumption Data
Prior to Installation
| Dates/Time Period | Gallons per Diem/Apt |
| 4/1/2014 to 3/4/2015 | 146 |
After Installation
| Dates/Time Period | Gallons per Diem/Apt |
| 4/15/2015 to 3/2/2016 | 109 |
Comments
Property not subject to sewerage charge.
Results Summary
| Reduction Percentage | 18% |
| Annualized Gallons Saved | 842,928 |
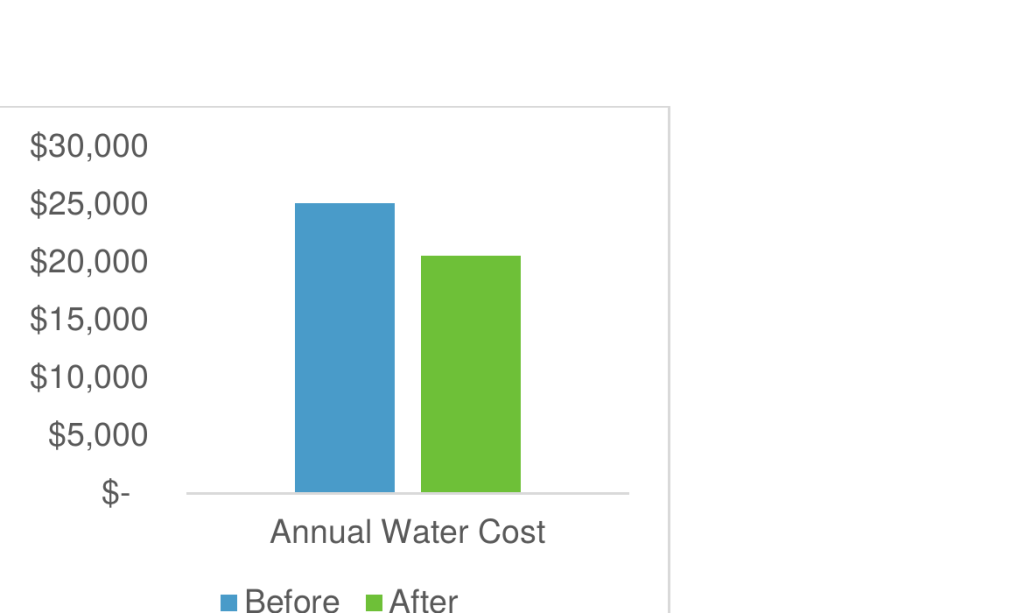
| Annualized Dollars Saved | $4,549 |
| 10-Year Savings Projection | $45,490 (based on current water rates) |
Chart: Daily Consumption (gal/unit) – Before vs. After
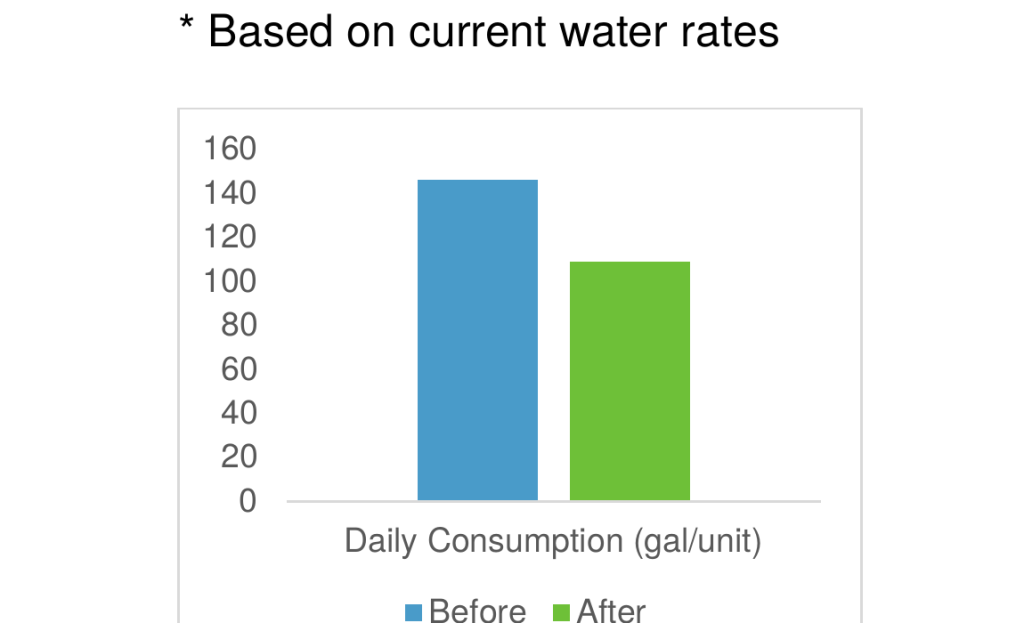
Chart: Annual Water Cost – Before vs. After
Detailed Water/Sewer Consumption Data
Courtyard Apartments – Hackensack, NJ | Affiliated Property Management | 80 Units | Smart Valve Installed 4/15/15
| Days | Period | Prior Rdg | Curr Rdg | Usage CF | Gallons | Gal/Day/Apt | Cost |
| 2014 | |||||||
| 29 | 1/6/14-2/4/14 | 4206 | 4690 | 484 | 362,032 | 156 | $2,116.45 |
| 27 | 2/4/14-3/3/14 | 4690 | 5116 | 426 | 318,648 | 148 | $1,878.10 |
| 29 | 3/3/14-4/1/14 | 5116 | 5545 | 429 | 320,892 | 138 | $1,890.43 |
| 29 | 4/1/14-4/30/14 | 5545 | 6021 | 476 | 356,048 | 153 | $2,083.57 |
| 35 | 4/30/14-6/4/14 | 6021 | 6563 | 542 | 405,416 | 145 | $2,361.42 |
| 28 | 6/4/14-7/2/14 | 6563 | 6990 | 427 | 319,396 | 143 | $1,889.46 |
| 28 | 7/2/14-7/30/14 | 6990 | 7441 | 451 | 337,348 | 151 | $1,988.54 |
| 34 | 7/30/14-9/2/14 | 7441 | 8026 | 585 | 437,580 | 161 | $2,545.35 |
| 29 | 9/2/14-10/1/14 | 8026 | 8578 | 552 | 412,896 | 178 | $2,409.36 |
| 34 | 10/1/14-11/4/14 | 8578 | 9110 | 532 | 397,936 | 146 | $2,326.94 |
| 28 | 11/4/14-12/2/14 | 9110 | 9502 | 392 | 293,216 | 131 | $1,749.98 |
| 2015 | |||||||
| 34 | 12/2/14-1/5/15 | 9502 | 9978 | 476 | 356,048 | 131 | $2,096.15 |
| 24 | 1/5/15-1/29/15 | 9978 | 10312 | 334 | 249,832 | 130 | $1,484.18 |
| 34 | 1/29/15-3/4/15 | 10312 | 10793 | 481 | 359,788 | 132 | $2,124.46 |
| 33 | 3/4/15-4/6/15 | 10793 | 11288 | 495 | 370,260 | 140 | $2,173.91 |
| 24 | 4/6/15-4/30/15 | 11288 | 11046 | 302 | 225,896 | 118 | $1,355.04 |
| 35 | 4/30/15-6/4/15 | 1590 | 2014 | 424 | 317,152 | 113 | $1,885.44 |
| 27 | 6/4/15-7/1/15 | 2014 | 2382 | 368 | 275,264 | 127 | $1,654.65 |
| 31 | 7/1/15-8/1/15 | 2382 | 2802 | 420 | 314,160 | 127 | $1,869.29 |
| 32 | 8/1/15-9/2/15 | 2802 | 3281 | 479 | 358,292 | 140 | $2,115.60 |
| 31 | 9/2/15-10/3/15 | 3281 | 3668 | 387 | 289,476 | 117 | $1,736.46 |
| 31 | 10/3/15-11/3/15 | 3668 | 4027 | 359 | 268,532 | 108 | $1,621.06 |
| 28 | 11/3/15-12/1/15 | 4027 | 4345 | 318 | 237,864 | 106 | $1,452.10 |
| 35 | 12/1/15-1/5/16 | 4345 | 4776 | 431 | 322,388 | 79 | $1,917.78 |
| 2016 | |||||||
| 29 | 1/5/16-2/3/16 | 4776 | 5145 | 369 | 276,012 | 82 | $1,662.84 |
| 28 | 2/3/16-3/2/16 | 5145 | 5503 | 358 | 267,784 | 82 | $1,619.66 |
11-Month Comparison Summary
| Avg Gal/Day/Apt | Avg $/Mo | |
| 11 Months Before Smart Valve | 146 | $2,096.31 |
| 11 Months After Smart Valve | 109 | $1,717.27 |
| Total 11-Month Savings | 18% | $4,169.49 |